Here’s a map created by Stamen comparing two different scenarios of climate change, depending on how much carbon we manage to cut.
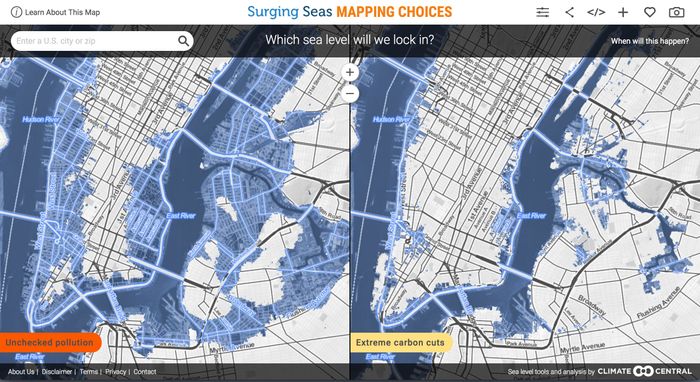
See also: a WIRED magazine article about the map.
Here’s a map created by Stamen comparing two different scenarios of climate change, depending on how much carbon we manage to cut.
See also: a WIRED magazine article about the map.