You’ve probably heard of the organization 350.org, whose name is derived from the concentration of carbon dioxide in the atmosphere:
What’s in a name? Ours, 350, is a number. And a very important one. It is a reference to 350 parts per million (ppm) – the concentration of carbon dioxide (CO2) in the atmosphere considered the safe limit to avoid the worst impacts of climate change. We are currently at 425.40 ppm.
So, as of this writing, there are around 425 CO2 particles found in a sample of air containing a million particles, or parts per million (ppm). Scientific instruments around the world measure this number each day, and we have a lot of data showing a steady increase in the amount of CO2 as emissions from fossil fuels continue to pollute the atmosphere and destabilize the climate.
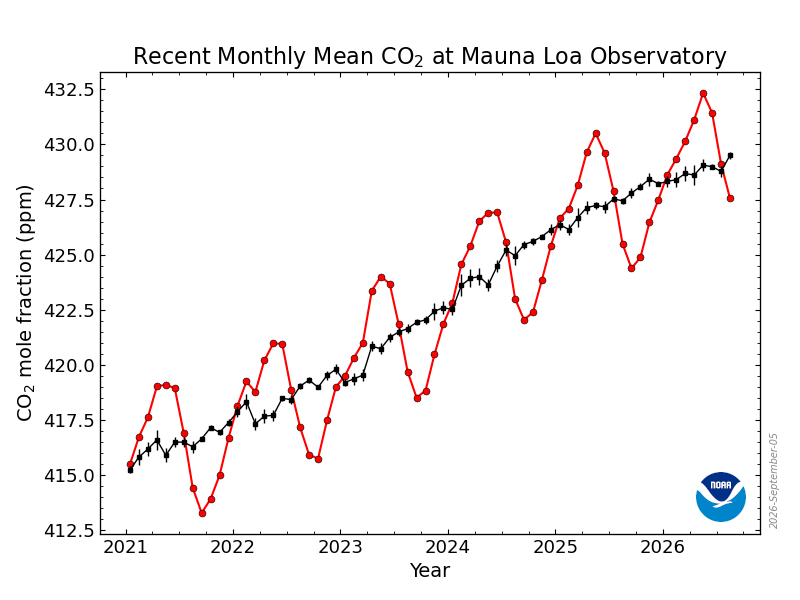
If you plot the concentration of CO2 on a graph, you’ll see an annual oscillation of high and low measurements. We reach a local minimum of CO2 concentration in September, climb to a maximum in May, then the pattern repeats into the following year’s September.
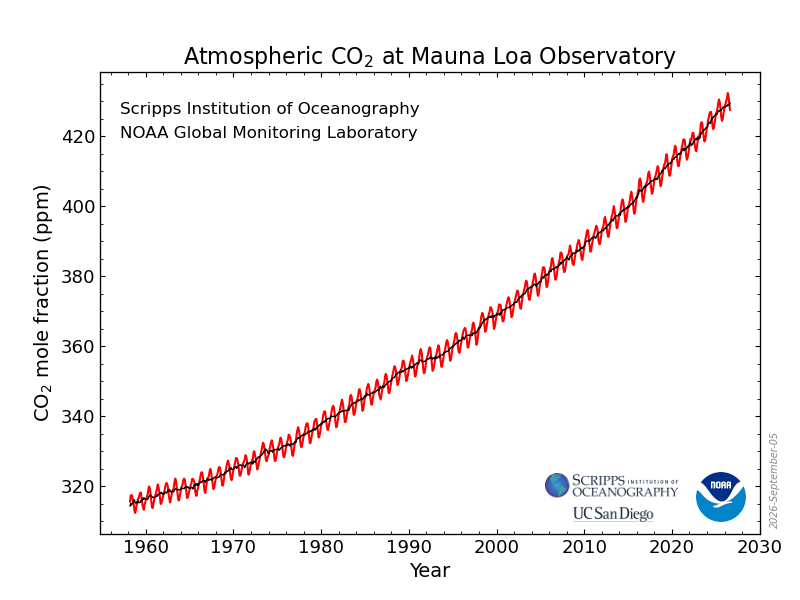
If you zoom out and look at the larger trend you’ll see a striking pattern—it looks like a sine wave tipped on an incline.
How much CO2 was there one year ago? How much CO2 was there ten years ago? Those questions have specific answers that can help us track the trends in this number that we all have some stake in, as it has an outsized impact on our collective future. The higher the CO2 concentration, the more unpredictable our climate future.
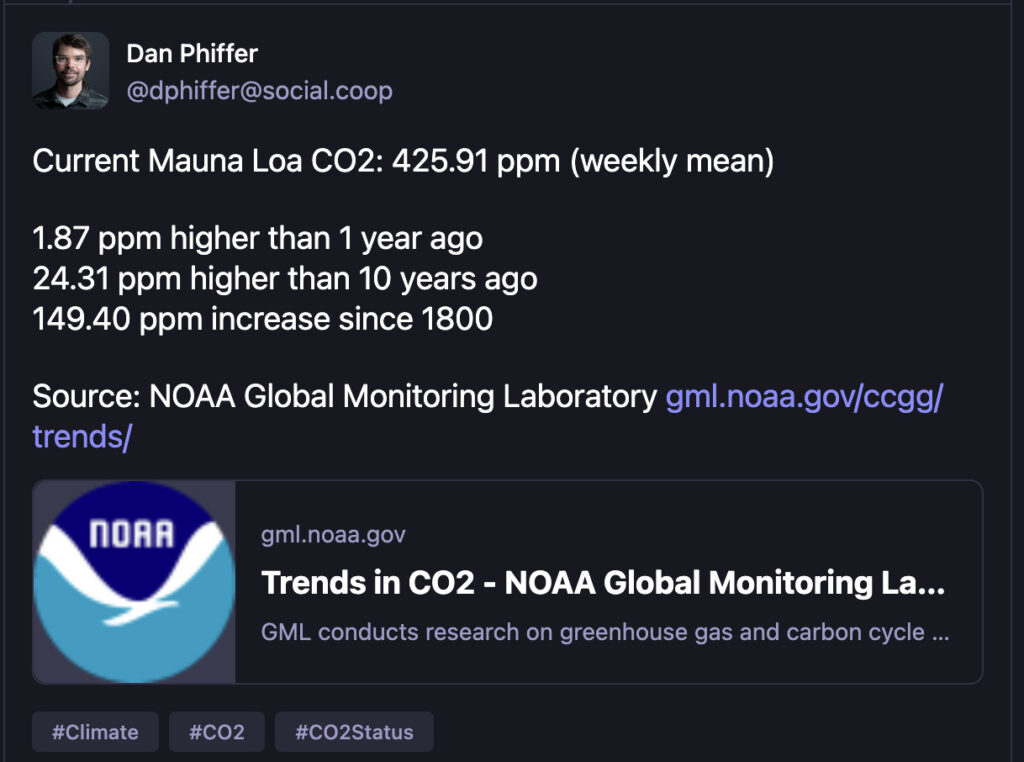
To help me keep tabs on the trend as a regular reminder, I wrote some scripts to post the weekly average of atmospheric CO2 as measured from NOAA’s Mauna Loa Baseline Observatory to my Mastodon account.
It looks like this: